
Data logging turns raw sensor readings into valuable insights by collecting accurate, consistent data over time. When you calibrate sensors regularly, you guarantee measurements are precise, reducing errors that could skew your analysis. Visualization tools then help you spot trends and anomalies quickly, allowing for proactive decisions. By combining calibration with effective data display, you can trust your insights and optimize processes. Keep exploring to discover how integrating these elements enhances your data-driven strategies.
Key Takeaways
- Accurate sensor calibration ensures reliable data collection, forming a solid foundation for meaningful insights.
- Continuous data logging captures real-time measurements, revealing patterns and trends over time.
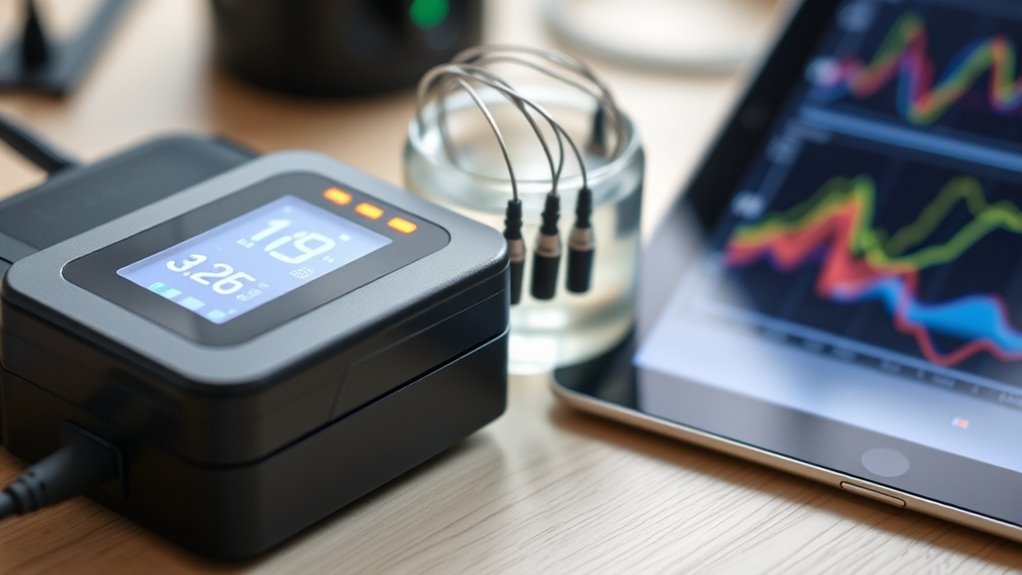
- Data visualization transforms raw readings into clear graphs and dashboards for quick analysis.
- Integrating calibration with visualization enhances data integrity, supporting confident decision-making.
- Insights derived from well-calibrated, logged data enable proactive responses and process improvements.
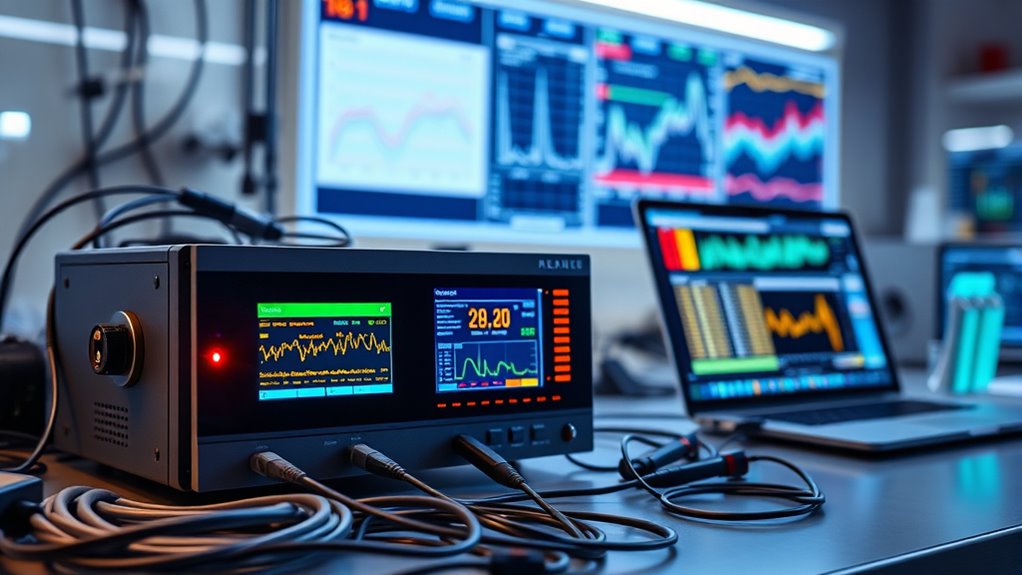
Data logging is the process of automatically collecting and recording data from various sources over time. It’s a powerful way to gain insights, monitor trends, and make informed decisions. When you set up a data logging system, you’re essentially capturing real-time information from sensors, devices, or other measurement tools. To guarantee the data you collect is accurate, sensor calibration becomes essential. Proper calibration aligns your sensors with known standards, minimizing errors and guaranteeing that your readings truly reflect the conditions you’re measuring. Without calibration, your data might be skewed, leading to incorrect conclusions. Once the data is captured, the next critical step is data visualization. Visual tools like graphs, charts, and dashboards turn raw numbers into understandable patterns. Instead of sifting through endless numbers, you see trends and anomalies immediately, which helps you react swiftly to changes or issues.
Accurate data logging relies on proper sensor calibration and effective visualization for clear insights and quick decision-making.
By focusing on sensor calibration, you improve the reliability of your data. When sensors are correctly calibrated, you reduce measurement drift and inaccuracies, ensuring that every data point is precise. This accuracy is fundamental because it directly impacts your ability to interpret results correctly. Regular sensor calibration checks are important because sensor degradation can occur over time, which may compromise your data’s integrity. Scheduling calibration routines keeps your measurements consistent and dependable. When combined with effective data visualization, calibrated sensors enable you to make confident decisions based on solid evidence. You’ll quickly recognize when something’s off, whether it’s a sudden spike in temperature or a drop in humidity, and respond accordingly. This proactive approach minimizes downtime and prevents costly mistakes.
In essence, your success with data logging hinges on two key elements: maintaining well-calibrated sensors and leveraging powerful data visualization. Calibration ensures your data’s accuracy; visualization makes this data accessible and actionable. When these components work together, you turn raw readings into meaningful insights that help optimize processes, improve safety, and drive innovation. Whether you’re monitoring environmental conditions, industrial processes, or scientific experiments, combining precise calibration with effective visualization puts you ahead in understanding your data landscape and making smarter decisions.

ADAS Radar Corner Reflector Kit with 0-30 Centimeter Scale Stand
- Universal Vehicle Compatibility: Fits Honda, Toyota, Kia, Ford
- ADAS Calibration Enhancement: Improves safety and system performance
- Durable Aluminum Reflector: Maintains shape and calibration accuracy
As an affiliate, we earn on qualifying purchases.
As an affiliate, we earn on qualifying purchases.
Frequently Asked Questions
What Industries Benefit Most From Data Logging?
You’ll find manufacturing automation and environmental monitoring industries benefit the most from data logging. It helps optimize processes, reduce downtime, and guarantee safety. In manufacturing, you can track machine performance and quality control. For environmental monitoring, data logging provides real-time insights into air, water, and soil conditions, enabling you to respond swiftly to potential issues. Overall, data logging enhances decision-making, efficiency, and compliance across these sectors.
How Secure Is Stored Data in Logging Systems?
Think of stored data in logging systems as a treasure chest; its security depends on strong locks like data encryption and access control. You can trust your data more when encryption shields sensitive info, making it unreadable to outsiders. Access control ensures only authorized users can view or modify data. While no system is foolproof, implementing these measures markedly boosts your data’s safety, keeping your insights secure from threats.
Can Data Logging Be Integrated With Existing Software?
Yes, data logging can be integrated with your existing software. You’ll want to check for compatibility issues first, guaranteeing the logging system supports your current platform and data formats. Many logging solutions offer APIs or plugins to facilitate seamless software integration. However, be prepared to troubleshoot potential compatibility issues, like data format mismatches or software version conflicts, to ensure smooth operation and accurate data analysis.
What Are the Common Challenges in Data Logging Implementation?
You might face challenges like ensuring sensor calibration accuracy and managing data redundancy. For example, a manufacturing plant struggled with inconsistent readings due to poorly calibrated sensors, leading to faulty insights. Implementing proper calibration protocols and redundant data systems can mitigate these issues. These steps help maintain data integrity, but they require careful planning and ongoing maintenance, which can be resource-intensive but are essential for reliable data logging.
How Does Data Logging Support Predictive Maintenance?
You can use data logging to support predictive maintenance by continuously collecting sensor data, which helps identify patterns and potential issues early. Accurate sensors guarantee reliable readings, while data visualization makes it easier to interpret trends. This proactive approach allows you to schedule maintenance before failures occur, reducing downtime and saving costs. By turning raw data into actionable insights, you keep your equipment running smoothly and efficiently.
Conclusion
By mastering data logging, you turn raw readings into powerful insights, helping you make smarter decisions. Think of it like having a modern-day oracle, guiding you through complex information. Whether you’re tracking temperature or monitoring machinery, consistent logging is your secret weapon. Remember, even in a world of smartphones, old-school note-taking still holds value—like a trusty quill in a digital age. Embrace data logging, and watch your understanding grow sharper than ever.